MAIN SPONSOR
MAIN CONTENT


The theme of the Brera Design District 2016 edition is “Designing is Listening”, a theme that highlights the didactic and educational power of good design. While it is true that a good teacher is someone able to imagine what a person could become even before it happens, a good designer (of any field) can see how the world will be through his work. Thanks to that, research and listening are deeply interconnected.
In this perspective, the Lezioni di Design 2016 award (Design lectures award) has been given to Giorgia Lupi, Italian information designer who has been working in New York for many years. Founder of Accurat, Giorgia represents the new generation of designers going beyond the traditional concept of product design.
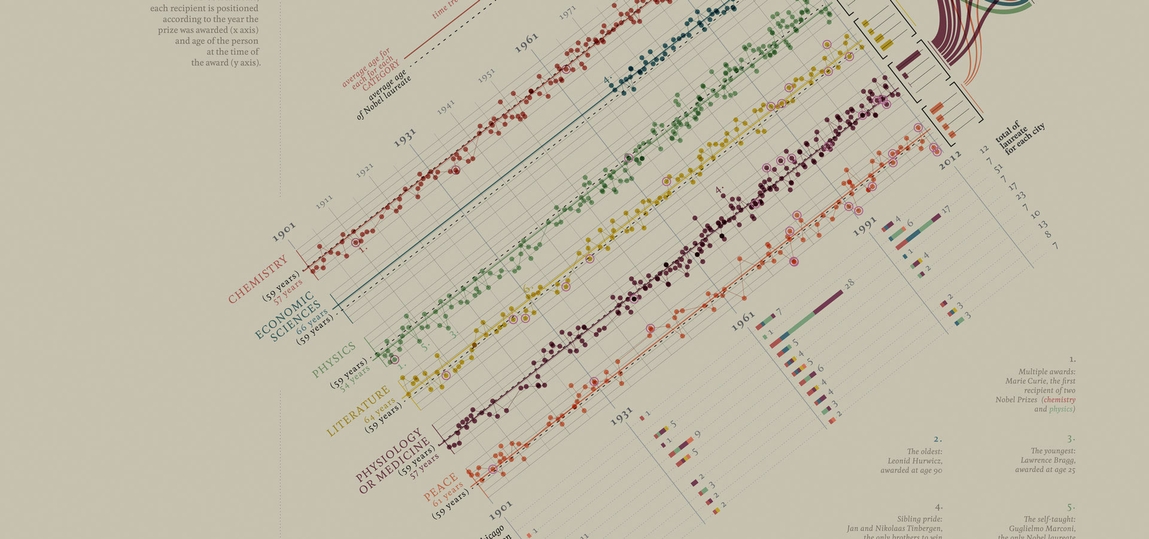
Giorgia Lupi is an Italian information designer living in New York. Her work in information visualization frequently crosses the divide between digital and print, exploring visual models and metaphors to represent rich data-driven stories. Giorgia challenges the impersonality that data might communicate, designing visual narratives that connect numbers to what they stand for: knowledge, behaviors, people.
In order to do your job, you must “listen” to the world, you need to set yourself in hearing mode all the time. How do you do that? Is it something spontaneous or is there a specific method you apply?
Yes, absolutely. To be a data visualization designer you have to find new ways to attract people’s attention through new languages and new solutions that besides being functional, accurate and appropriate must be magnetic and surprising. To this regard, I believe that learning how to “visually listen” to the world is essential: learning how to SEE is essential to learn how do design. Learning to see and to understand what are the aesthetic qualities that attract our eyes about our surroundings is essential for creators of any kind. What I always do when I start every kind of project is allowing myself to get truly inspired by the world that is around me. Looking for clues in unusual contexts is a valuable way for me to discover and dissect the aesthetic qualities of all the things that I naturally like, as a constant resource for inspiration, and in order to be able to abstract them and introduce them as core principles and guidelines in my work. Just by paying attention to what happens in our mind while looking at the world around us ,we can force ourselves to learn how to see, and how to recognize the qualitative features of all the different images we see. With time we can learn to parse these features and recall them while creating something new.
You have said that you are particularly attracted by common forms of visualization. What is the relationship between familiarity and innovation in your work?
I realized I am mostly inspired by visual languages that are somehow already conventional, the aesthetics of which are familiar to our minds: if a set of aesthetic rules for shapes, for colors, and for spatial composition works in a context I observe, I believe there should be a way to apply them to the designs I am working on. The visual contexts I am referring to are abstract art, but also the repetitive aesthetics of music notations, especially contemporary music notations, or the layering systems of architectural drawings, or even the shapes and features of objects and natural elements: visual environments our minds can refer to even without really getting it. I would then define successful designs as the ones able to balance convention (i.e. familiar forms our minds are already familiar with) and novelty: new features that can engage and delight people in the hope they will stick around our visualizations a bit longer, and in the hope we can help the conversations in our fields moving forward.
Could you be defined as an artisan of data? What’s the role of hand-crafted in your job?
I like that! :) I indeed work with data in a very hand-crafted way. When I work on any kind of data visualization projects I produce tons of sketches even before pulling in the data in any sort of tool that can return me with a draft chart. I sketch to understand how to spatially organize data, to define both the architecture of the composition and the visual aspects of the tiny details. I’ve always used this laborious process as a way to engage with my data before creating the final digital visualizations. For many readers, the word “data-visualization” might be associated with heavy programming skills, complex softwares and huge numbers for the most part, but, believe it or not, lots of data visualization designers use old-fashioned sketching and drawing techniques on paper as their primary design tool: they sketch with data to understand what is in the numbers and how to organize those quantities in a visual way to gain meaning out of it.
Many people fear that the excess of data could kill spontaneity, but you said that data can help us live a better life. How is this possible?
For the Dear Data project, (www.dear-data.com) I’ve spent over one year collecting personal data around different topics (my obsessions, my routines, my desires, my negative thoughts, my positive feelings, bits of my relationship with my partner….). But instead of relying on a self-tracking digital app, I collected my data manually, adding contextual detail to each one of my logs, and thus making them truly personal, about me and me only. In a moment when self-tracking apps are proliferating, and when the amount of personal data we can collect about ourselves is increasing over time, we should actively add personal and contextual meaning to our tracking. We shouldn’t expect an app to tell us something about ourselves without any active effort by us, we really have to engage in sense making of our own data. I like to say that data can be a state of mind, that data can be an attitude more than a matter of skills and tools, and ultimately that data can help us becoming more human and connecting with ourselves and others at a deeper level if we put on the right glasses to see it.
What’s the role of art in your job? How can you merge such an artisti and poetic touch with the hard cold data?
I personally see data visualization as the combination of my ‘artistic’ (or, better said, emotional!) side and my rational and scientific one; I have a background in architecture and my mind needs to structure and organize information, but my eyes and my spirit need to see and invent unexpected visuals every time, I guess. I enjoy designing visual artifacts that have a logical and structural sense, I don’t take pleasure in producing graphic designs per se, I do instead take pleasure in shaping visual ways to represent quantitative and rigorous parameters. What drives me in what I do is the overlapping space between analysis and intuition, between logic and beauty, between numbers and images.
If you were a teacher, what would you teach?
The mathematic of art, or the art of mathematic.